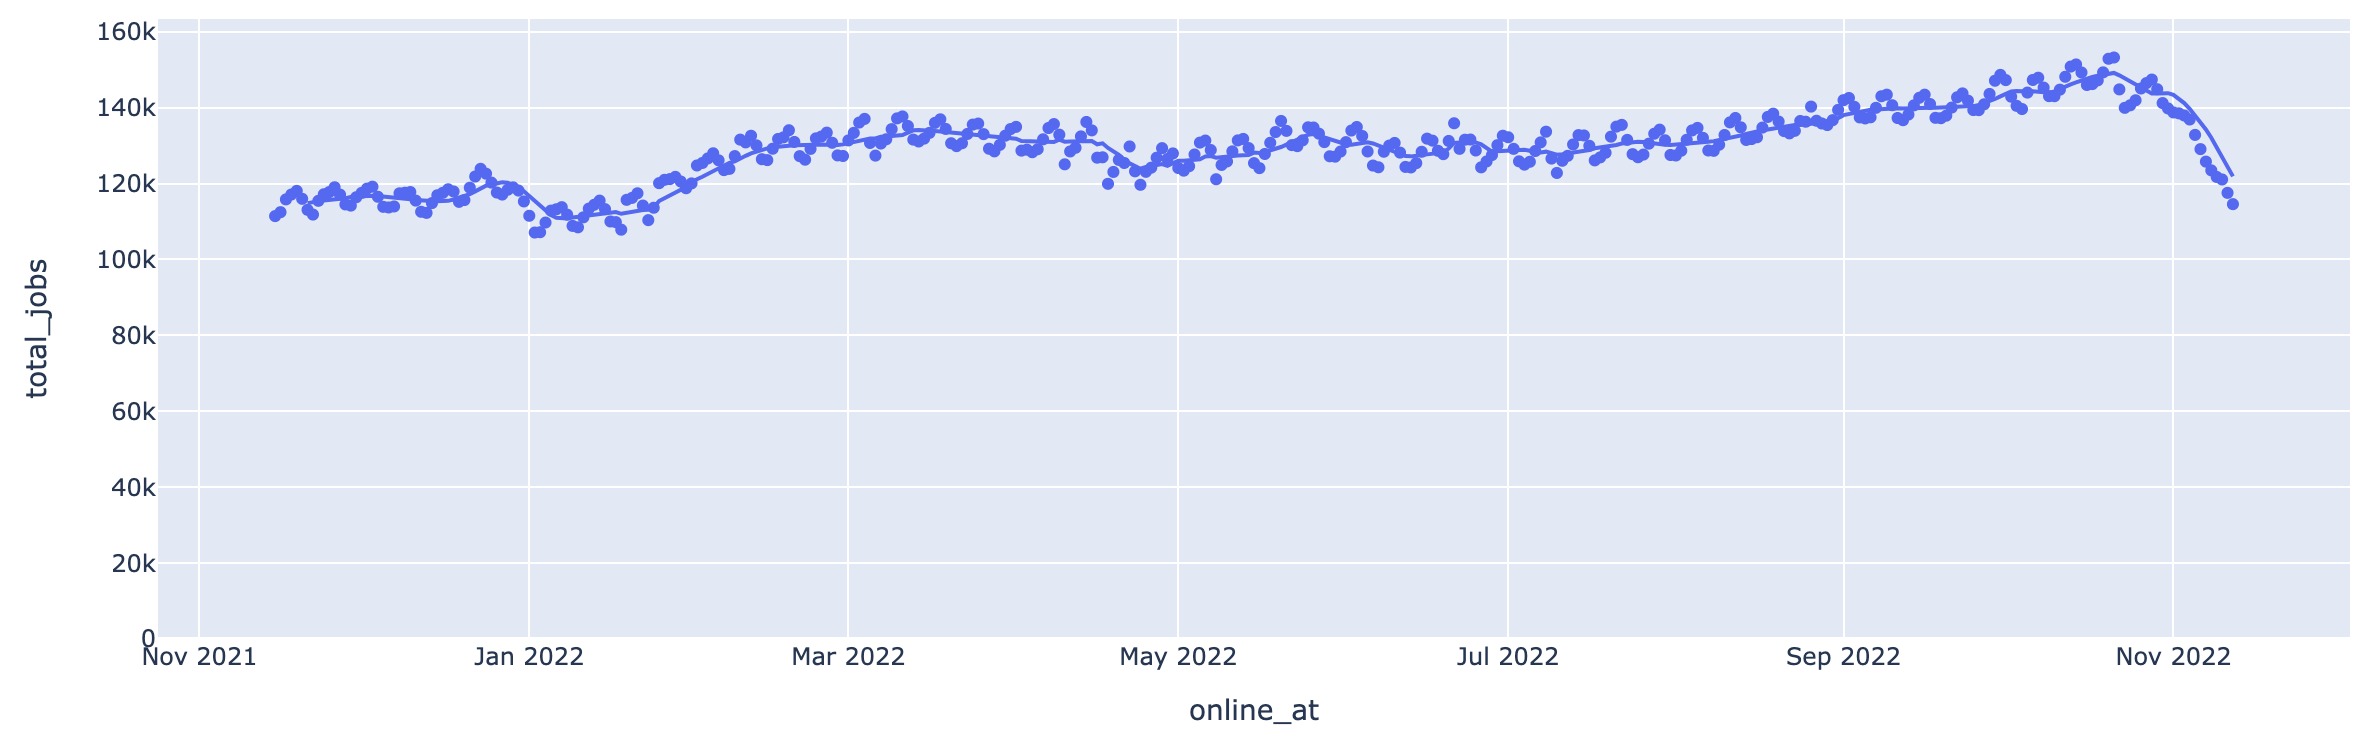
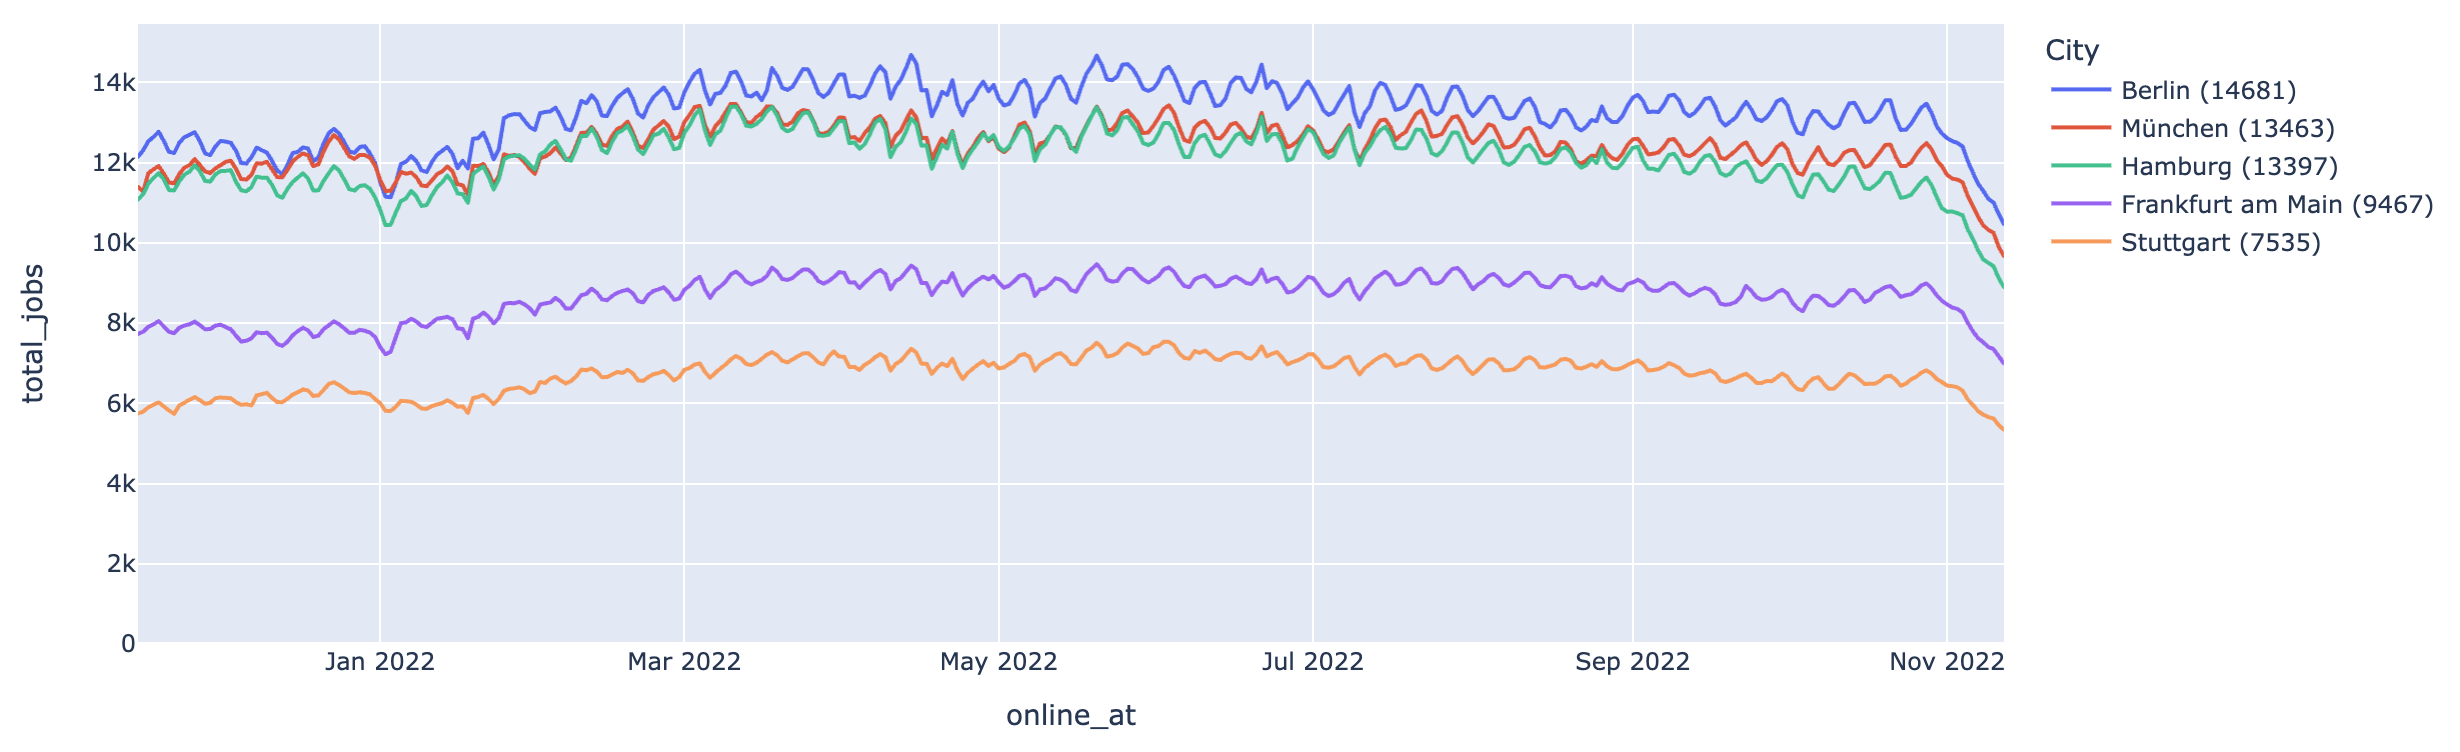
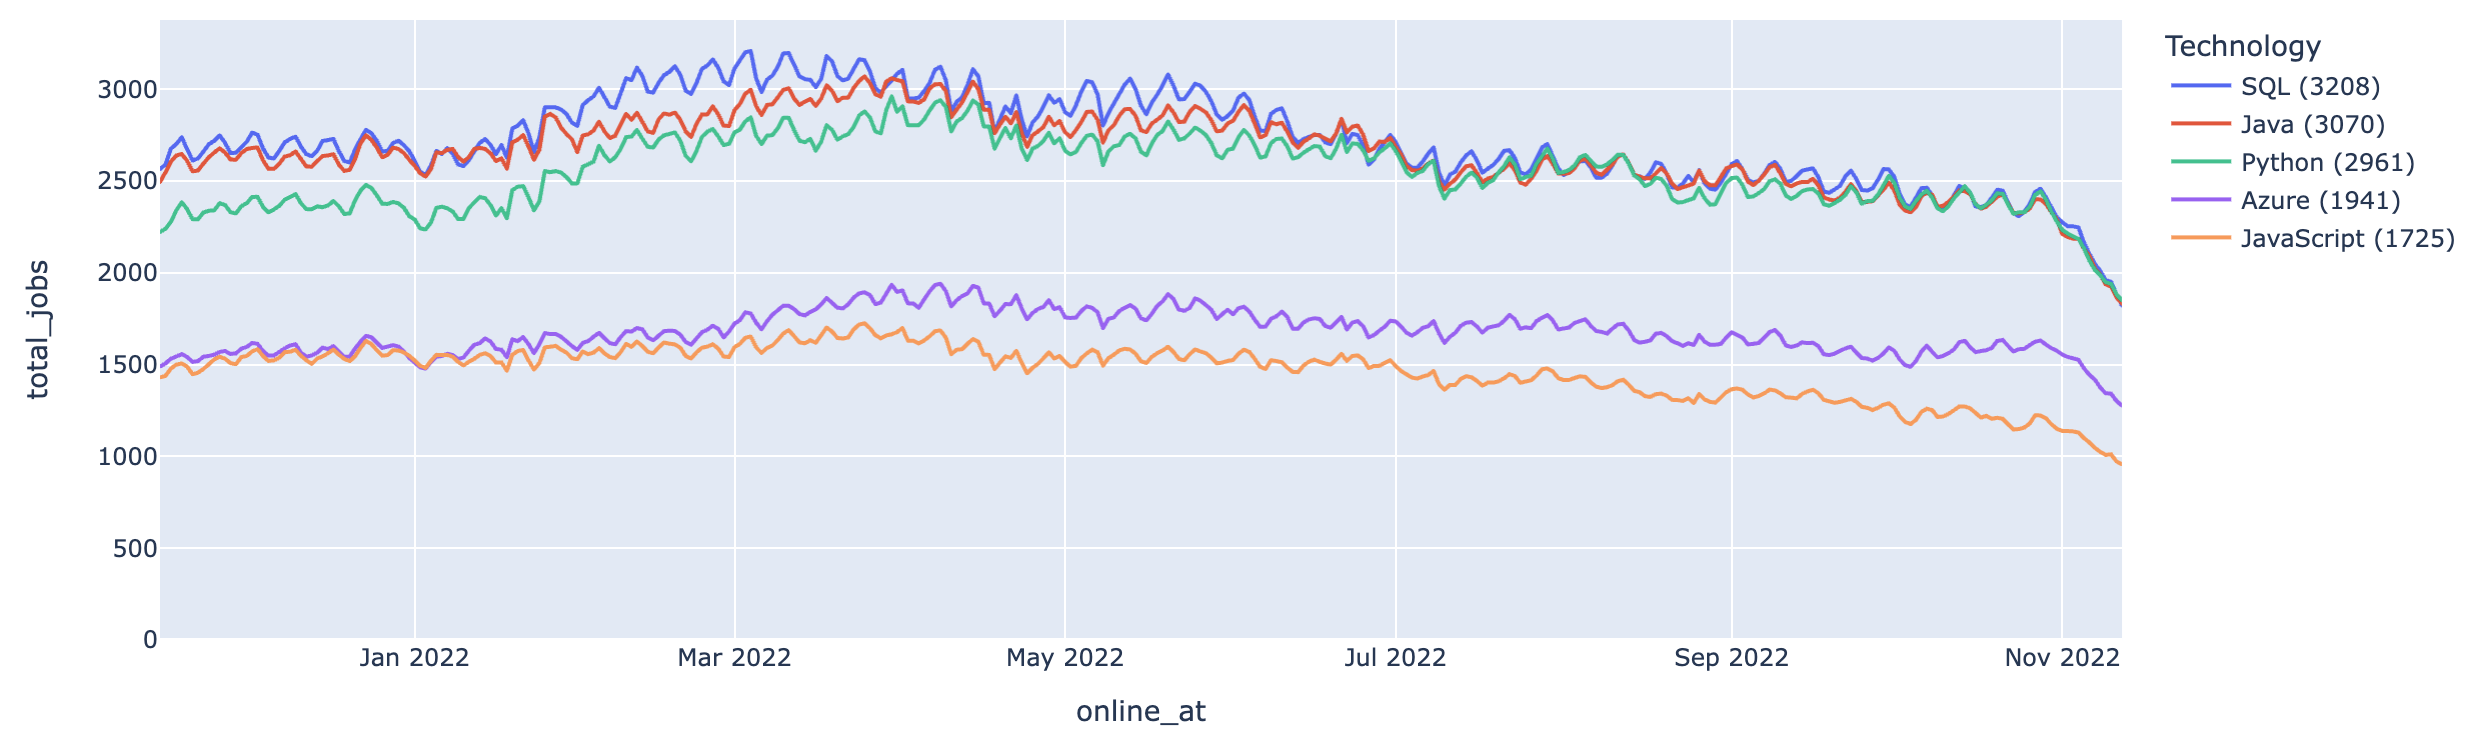
After some research, my hypothesis might be wrong. Comparing the different data sources I have found out that there is a drop only in one them, so my best guest is that an increase in the job post price or a change in the business model (e.g. shortening the length of the time a job is posted) is the most likely reason for the drop we can see in November.
OP's disclaimer: I started this hobby project one year ago. The point of this project was and still is to learn about new technologies. Maybe I am lacking the statistical background, or the data since it goes back only 13 months, to make such an statement but when I starting seeing these trends in the number of job posts, I thought that it would be interested to share it in the Hacker News community and get some feedback.
About whether these trends that we see in the graphs are something real or just a data issue like seasonality or a problem with the data sources, I think we will soon know from the mainstream media. As always the time will tell.
As the Dash frontend wasn't able to handle the traffic I have replaced the dynamic dashboard with static HTML, sorry for that. I will replace it with the real dashboard when I am able to handle the traffic.
I would take no offence, the dashboard is implemented with https://dash.plotly.com/ which is a great tool for prototyping but doesn't seem to handle concurrent users very well.