NetApp StorageGRID uses Cassandra according to their docs. "Three copies of object metadata are automatically maintained at each site to provide redundancy and protect object metadata from loss. The copies are load balanced across all Storage Nodes at each site."
This was required reading for an engineering management course and is one of the few texts that I find myself thinking back on many years later. I strongly second this recommendation.
I completely agree that breakfast at conferences has been a fantastic opportunity to meet fellow attendees. Conversation is quite easy to strike up by asking which talks the table is planning to attend.
The newer winterfell nodes [1] have made their way to ebay at sub 100$ and do not have the exotic power requirements of the earlier dual sled windmill nodes. You can easily power them off of a converted server power supply via diy [2] or commercial [3] means. Windmill nodes have more space on the pcie riser and quieter fans going for them as well.
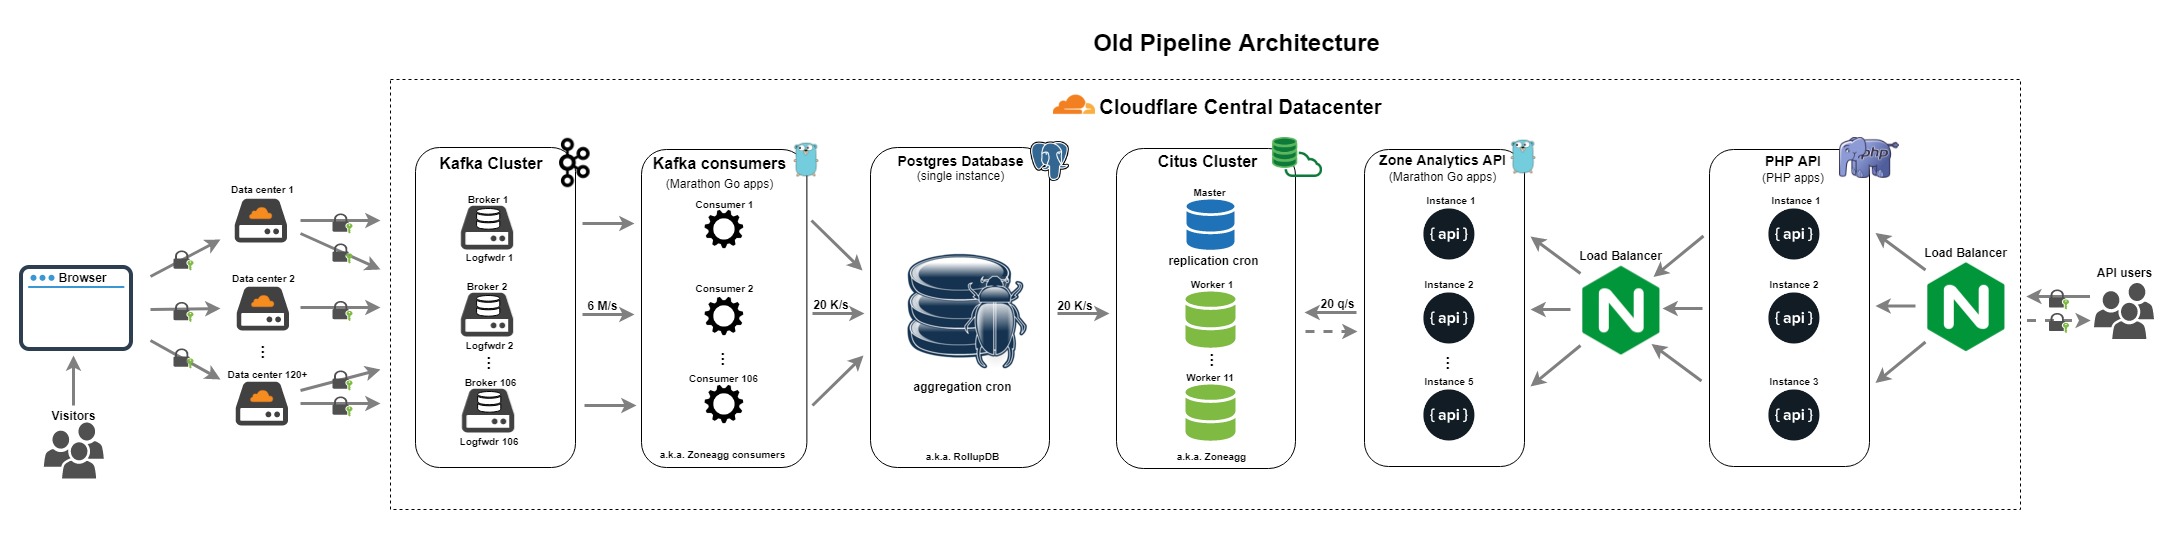
In a follow up blog post https://blog.cloudflare.com/http-analytics-for-6m-requests-p... Cloudflare released the following image https://blog.cloudflare.com/content/images/2018/03/Old-syste... with 'single instance PostgreSQL database (a.k.a. RollupDB), accepted aggregates from Zoneagg consumers and wrote them into temporary tables per partition per minute' as the description for the single Postgres instance depicted. The aggregation system described in the Citus blog distributes the aggregation work over multiple Postgres instances.
Using a tool like diskplorer (mentioned in article 1) to gather the concurrency and IOPS relations at various read sizes (mentioned in article 2) seems like it a good datapoint for use in tuning a database filesystem. https://github.com/avikivity/diskplorer
As long as you turn a PG table into a BQ dataset with enough partitions (BQ tables) such that queries do not touch a disproportionate amount of unnecessary data, you utilize date partitioning, and you can deal with a minimum 1.5 second query time the service is truly amazing. My only frustrations are that the majority of streaming service degradations are never noted on the Status dashboard and that you can get really odd error states like headers stating that you should be getting json while the body contains a html error message.
Looking through the public Grafana dashboards I noticed that the database backups page is not showing any data points (http://monitor.gitlab.net/dashboard/db/backups). Is this meant to a public page?